D-Layer Absorption & Space Weather Monitor

HF amateur bands vs. solar tantrums – driven by GOES X-ray flux

Refresh in 5:00

What you’re looking at

This page turns GOES X-ray flux (0.1–0.8 nm) into a simplified, ham-focused D-layer absorption risk index. It’s designed to answer one practical question: “Which HF bands are likely to be getting sat on right now?”

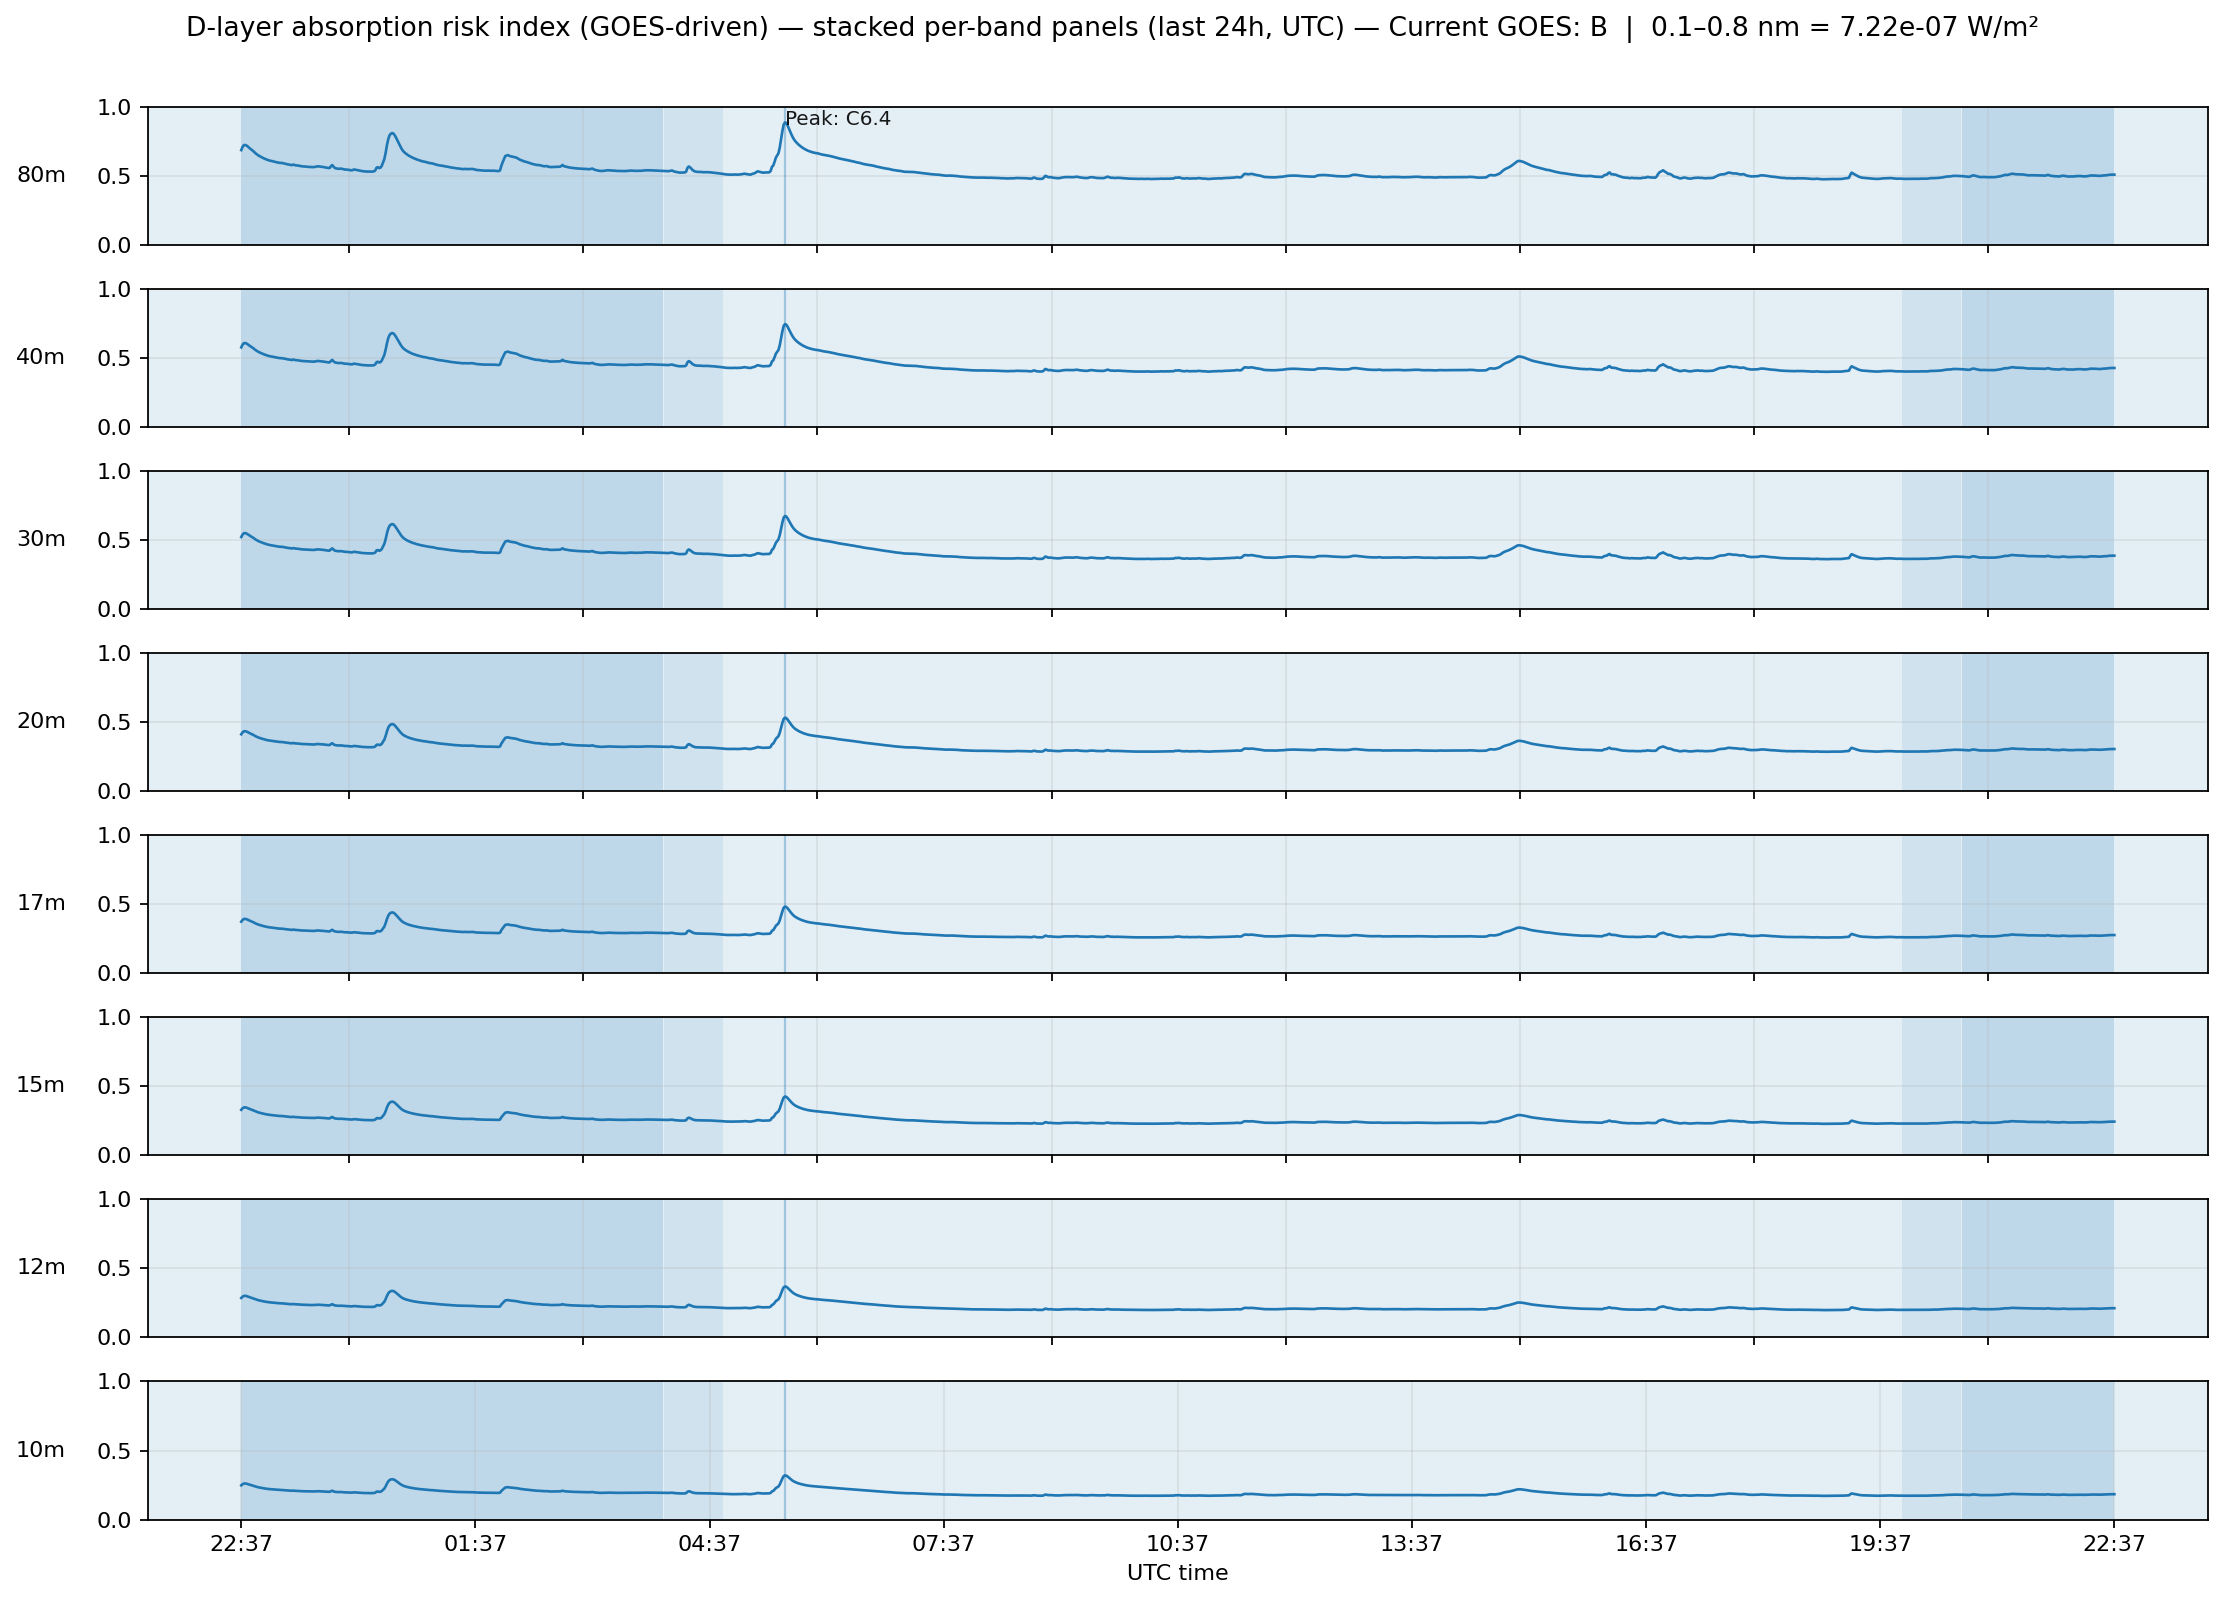
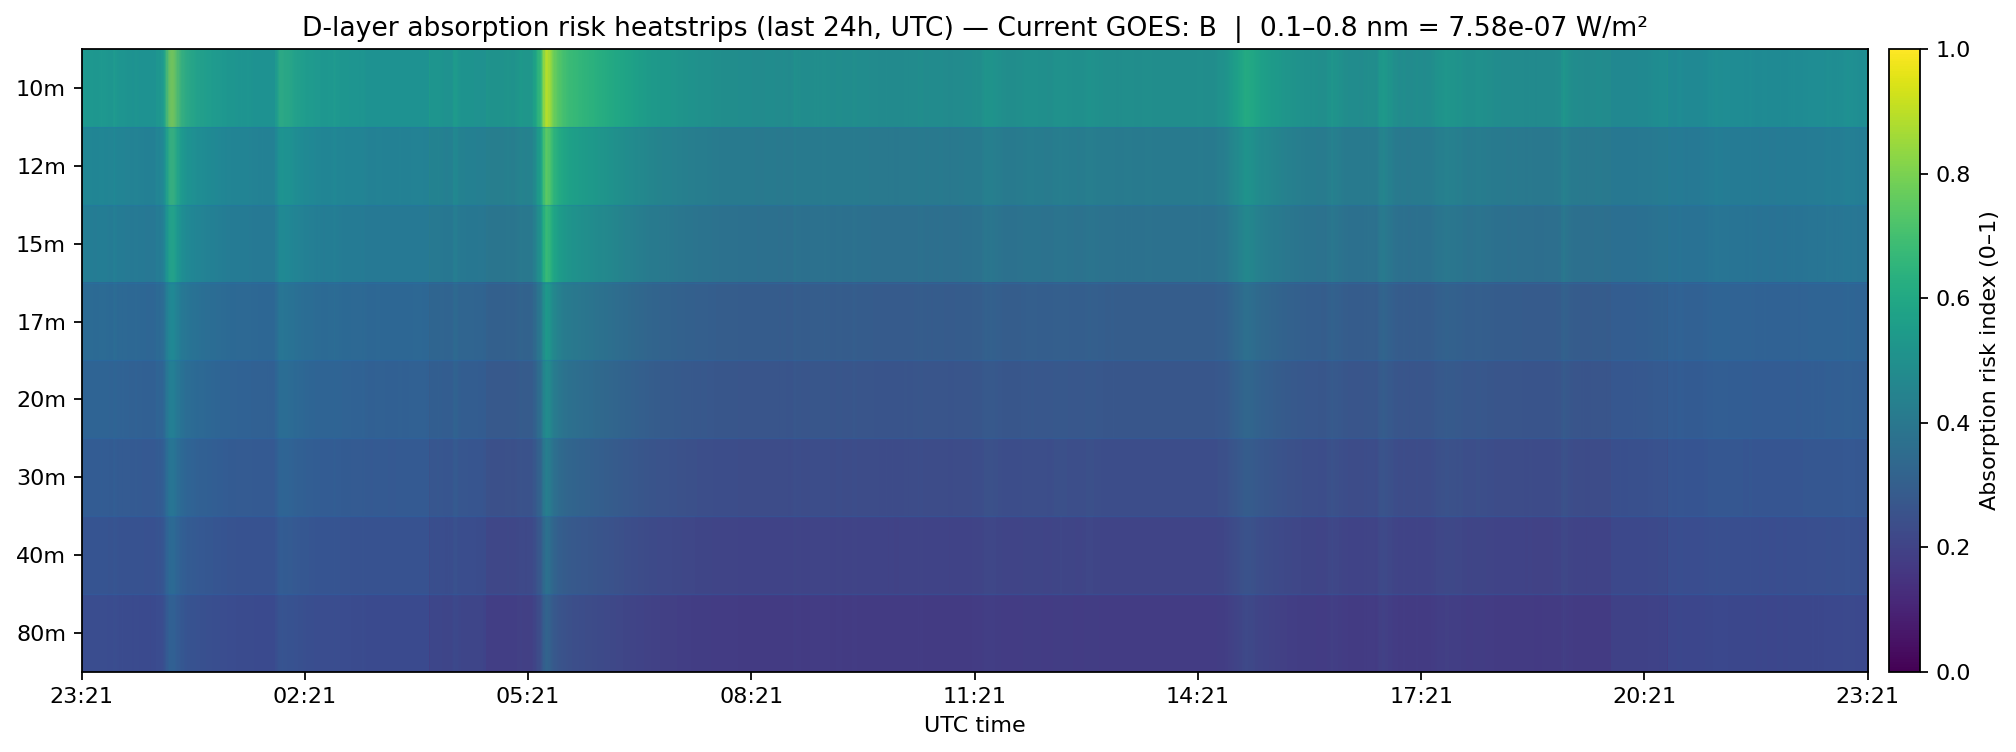
How to read it: as the index rises, daytime D-layer absorption increases first on 80 m / 40 m, then progressively higher bands. Strong M/X-class events can produce shortwave fadeouts on sunlit paths. This is not an official DRAP product — it’s a data-driven “operator view” derived from public space-weather feeds.

Low Elevated Severe Near / total fadeout ( threshold guide; plots use continuous colour )
Updated: 2026-08-02 21:57 UTC — GOES 0.1–0.8 nm: B-class (7.02e-07 W/m²)

Live HF “vibes” + 24h absorption view Updated regularly

HF Propagation Vibes (GOES-driven)
HF Propagation Vibes — a stylised, GOES-driven snapshot (operator view)
D-layer absorption risk heatstrips (last 24 hours, UTC)
Heatstrips (last 24h, UTC) — quick “which bands got hit?” overview
D-layer absorption risk stacked per-band panels (last 24 hours, UTC)
Stacked panels (last 24h, UTC) — event shape by band (rise / peak / recovery)
NOAA DRAP global D-layer absorption map (highest HF frequencies affected by 1 dB absorption)
NOAA SWPC DRAP (global) — quick visual context for sunlit-path absorption.