Last Updated: 2026-10-14 00:00 UTC
🟥 D-Layer Absorption & Space Weather Monitor
Live DRAP/GOES-style view for “why did 40 m just go to the pub?” moments.
Tropo conditions: Tropo weak or flat — little enhancement expected.
External tropo check:
F5LEN Europe Tropo Forecast
Mode guide:
Tropo mode definitions (TR / AP / ducting etc.)
A. NOAA Geomagnetic Activity Observation and Forecast

The greatest observed 3 hr Kp over the past 24 hours was 3 (below NOAA
Scale levels).
The greatest expected 3 hr Kp for Oct 13-Oct 15 2026 is 4.67 (NOAA Scale
G1).

NOAA Kp index breakdown Oct 13-Oct 15 2026

             Oct 13       Oct 14       Oct 15
00-03UT       3.33         3.67         2.67
03-06UT       3.33         4.00         3.33
06-09UT       2.00         2.67         3.00
09-12UT       3.00         3.67         2.33
12-15UT       3.33         3.67         1.67
15-18UT       3.67         3.67         1.00
18-21UT       4.00         3.33         1.33
21-00UT       4.67 (G1)    2.67         2.33

Rationale: G1 (Minor) geomagnetic storming is likely on 13 Oct due to
negative polarity CH HSS influences combined with possible flanking CME
influences.
B. NOAA Solar Radiation Activity Observation and Forecast

Solar radiation, as observed by NOAA GOES-18 over the past 24 hours, was
below S-scale storm level thresholds.

Solar Radiation Storm Forecast for Oct 13-Oct 15 2026

              Oct 13  Oct 14  Oct 15
S1 or greater    5%      5%      5%

Rationale: No S1 (Minor) or greater solar radiation storms are expected.
No significant active region activity favorable for radiation storm
production is forecast.
C. NOAA Radio Blackout Activity and Forecast

No radio blackouts were observed over the past 24 hours.

Radio Blackout Forecast for Oct 13-Oct 15 2026

              Oct 13        Oct 14        Oct 15
R1-R2           35%           35%           35%
R3 or greater    5%            5%            5%

Rationale: A chance for R1-R2 (Minor-Moderate) radio blackouts due to
isolated M-class flare activity will persist through 15 Oct.
Issued: 2026 Oct 12 0344 UTC
Highlights of Solar and Geomagnetic Activity
05 - 11 October 2026

Solar activity was at very low to (R1-R2 - Minor-Moderate) levels
throughout the summary period. Region 4545 (N17, L=222, class/area
Dso/070 on 08 Oct) produced an impulsive M1.0 (R1 - Minor) flare at
05/1848 UTC. Region 4547 (N15, L=274, class/area Cri/030 on 06 Oct)
produced an M1.3 flare at 09/1409 UTC as the region exited the west
limb. The majority of the activity was observed from Region 4549
(N10, L=216, class/area Eki/260 on 09 Oct). During the period, the
region produced 39 C-class, 3 R1-Minor, and 2 R2-Moderate flares. It
produced an M6.7/2b flare at 08/1548 UTC with an associated Type II
Sweep with an estimated velocity of 4,125 km/s and a Type IV Sweep.
At 10/1510 UTC, this region produced an M6.4/1n flare with an
associated Type II Sweep with an estimated velocity of 929 km/s and
a 240 sfu Tenflare. The largest region on the disk, Region 4551
(S15, L=102, class/area Eko/400 on 11 Oct) produced 3 C-class
flares. In total, 50 C-class and 7 M-class events were observed.

No proton events were observed at geosynchronous orbit.

The greater than 2 MeV electron flux at geosynchronous orbit reached
high levels on 05-08 Oct and 10 Oct with a peak of 11,300 pfu
observed at 08/1250 UTC. Normal to moderate levels were observed on
09 and 11 Oct.

Geomagnetic field activity ranged from quiet to G3-Strong levels
during the period. Quiet to G1-Minor levels were observed on 05 Oct
and quiet to unsettled levels were observed on 06 Oct, all due to
influences from a positive polarity CH HSS. Mostly quiet levels were
observed on 07-08 Oct. Activity increased on 09 Oct when unsettled
to active levels were observed due to weak influence from a 06 Oct
CME. Activity levels increased further on 10 Oct when unsettled to
G3-Strong levels were observed due to continued influence from CME
activity observed on 06 and 07 Oct. During this level of high
activity, total magnetic field strength increased to a peak of 45 nT
at about 10/1500 UTC and Bz observed some southward deflections to
30 nT at about 10/1630 UTC. Solar wind speeds rapidly increased from
about 380 km/s at 10/1500 UTC to a peak of about 890 km/s at 10/1755
UTC. Associated with this CME activity was some influence from a
negative polarity CH HSS.
Forecast of Solar and Geomagnetic Activity
12 October - 07 November 2026

Solar activity is likely to continue at very low to low levels with
isolated R1-Minor levels possible throughout the period.

No proton events are expected at geosynchronous orbit.

The greater than 2 MeV electron flux at geosynchronous orbit is
expected to be at high levels on 14-15 Oct, 23-28 Oct, and 01-04
Nov, all due to anticipated influence from multiple, recurrent CH
HSSs.

Geomagnetic field activity is expected to be reach G1-Minor
geomagnetic storm levels on 13 and 31 Oct , and 01 Nov. Active
levels are likely on 12, 22, and 23 Oct. Unsettled levels are likely
on 14-15, 21, and 24 Oct and 02 and 06-07 Nov. All increases in
goemagnetic activity are associated with anticipated influence from
multiple, recurrent, coronal hole HSSs. The remainder of the outlook
period is likely to be at mostly quiet levels.
| Date (UTC) | F10.7 | Ap | Largest Kp |
|---|---|---|---|
| 2026-10-12 | 120 | 16 | 4 |
| 2026-10-13 | 115 | 28 | 5 |
| 2026-10-14 | 110 | 14 | 3 |
| 2026-10-15 | 105 | 8 | 3 |
| 2026-10-16 | 100 | 5 | 2 |
| 2026-10-17 | 95 | 5 | 2 |
| 2026-10-18 | 95 | 5 | 2 |
| 2026-10-19 | 100 | 5 | 2 |
| 2026-10-20 | 100 | 5 | 2 |
| 2026-10-21 | 105 | 15 | 3 |
| 2026-10-22 | 100 | 20 | 4 |
| 2026-10-23 | 100 | 15 | 4 |
| 2026-10-24 | 95 | 10 | 3 |
| 2026-10-25 | 95 | 5 | 2 |
Modelled MUF estimates based on current solar indices and UTC hour.
| Path | Estimated MUF | Notes |
|---|---|---|
| Western Europe → East Coast NA | 20 MHz | 20 m stable; 15 m closes by dusk |
| Western Europe → South America | 23 MHz | 17/20 m steady south path |
| Western Europe → Oceania (Short) | 16 MHz | Best chance at greyline; 17 m possible |
| Western Europe → SE Asia | 18 MHz | 20 m stable route; 17 m variable |
| Western Europe → Trans-equatorial Africa | 21 MHz | 17/20 m workable into night |
Latest DRAP absorption map (courtesy of NOAA SWPC):

Dark red areas indicate significant D-layer absorption. Useful for spotting potential HF blackouts.
G7IZU HF MUF Plot (Latest):
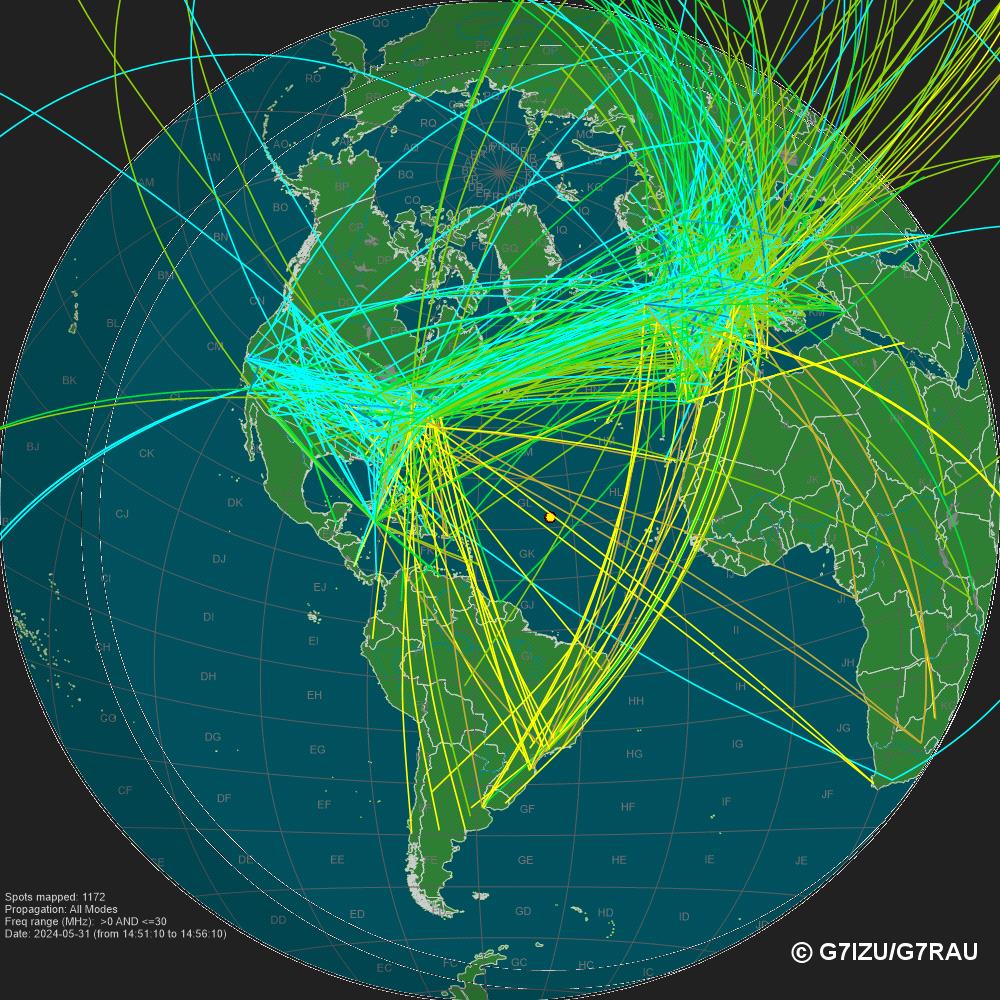
G7IZU Sporadic-E Map (Latest):

Both images auto-refresh regularly and reflect near-real-time ionospheric and Es propagation.